The Racial Dot Map
Posted on
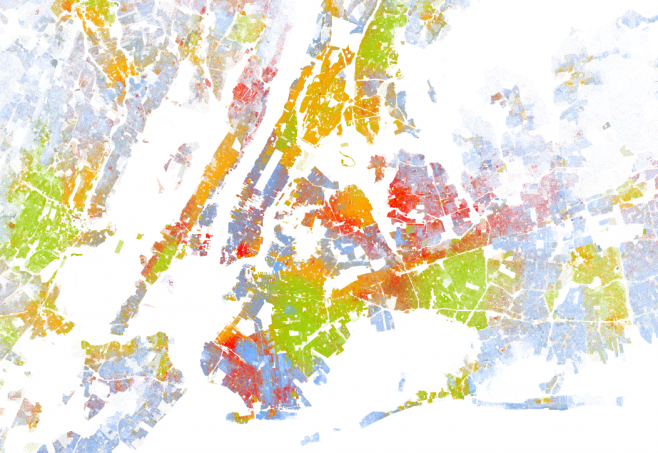
Check out The Racial Dot Map - the most comprehensive map of racial distribution in the United States.
This data visualization based on population data from the 2010 Census was created by Dustin Cable at University of Virginia's Weldon Cooper Center for Public Service.
Each dot represents one person (who responded to the U.S. Census) and each dot is color-coded according to race: white people are represented by a blue dot, black people = green, Asian people = red, Hispanic people = orange, and multiracial people as well as Native American people are represented by a brown dot. You can zoom in and out and clearly see regional patterns and multi-color clusters around cities. Zooming in on Brooklyn, one can see how the diverse borough is a patchwork of neighborhoods with racial majorities - some areas are mostly green, others mostly red, etc.
via Wired